EVM Debugger was born from a simple observation: blockchain developers needed better tools to understand what happens inside their smart contracts. While building blockchain solutions for clients, our team at Rumble Fish recognized a significant gap in the developer tooling ecosystem. Debugging smart contracts on Ethereum and other EVM-compatible chains was unnecessarily complex, requiring developers to piece together information from multiple sources and interpret low-level bytecode without clear visualization.
We decided to create something that would change this - a free, comprehensive tool that would make smart contract debugging accessible to every developer, regardless of their experience level. What started as an internal passion project evolved into a two-year journey that significantly boosted the ecosystem of blockchain developer tools.
Creating a debugger for the broader blockchain developer community presented unique technical hurdles that went far beyond typical software development. The team needed to dive deep into the inner workings of the Ethereum Virtual Machine and the Solidity compiler to create something truly useful.
Understanding Low-Level Solidity ExecutionThe first major challenge was bridging the gap between high-level Solidity code and low-level EVM execution. When a smart contract runs on the blockchain, it's compiled into bytecode that bears little resemblance to the original source code. To provide meaningful debugging information, we needed to understand exactly how Solidity operates at the machine level - every opcode, every stack operation, every memory allocation.
Mapping Source Code to ExecutionPerhaps the most complex challenge was matching the source maps generated by the Solidity compiler to what actually happened during transaction execution. Source maps are the bridge between readable code and bytecode, but they're notoriously difficult to work with. We had to develop sophisticated algorithms to accurately correlate each line of Solidity code with its corresponding execution steps in a transaction, accounting for compiler optimizations, inline functions, and complex call hierarchies.
Multi-Chain CompatibilitySupporting multiple networks, the Ethereum mainnet, Polygon, and Amoy testnet, added another layer of complexity. Each network has its own quirks, performance characteristics, and data availability patterns. Our solution needed to work seamlessly across all of them while maintaining accuracy and performance.
To overcome these challenges, we architected a multi-layered system that distributed the computational workload intelligently across different components.
AWS-Powered Transaction TracingAt the core of our solution was a robust backend infrastructure hosted on AWS that generated detailed transaction traces. Using SQS and DynamoDB, we built a scalable service that could process transactions from multiple networks simultaneously. This backend handled the heavy computational lifting - executing transactions in a controlled environment and capturing every state change, every opcode execution, and every internal call.
Automated Source Map GenerationWe developed a sophisticated pipeline that automatically fetched verified contract source code from Etherscan and generated comprehensive source maps. This system parsed the Solidity code, analyzed the compiler output, and created a detailed mapping between source code lines and EVM bytecode instructions. The challenge wasn't just generating these maps, but ensuring they remained accurate across different Solidity compiler versions and optimization levels.
Unified Frontend ExperienceThe frontend, built with React and Material UI, served as the orchestration layer that brought everything together. It wasn't just about displaying data, but also involved complex data transformation and presentation logic. The interface needed to take raw transaction traces, source maps, and blockchain state data, then transform them into intuitive visualizations that developers could actually use. Gas usage graphs, call trees, state diffs, and source code highlighting all had to work in harmony.
Our TypeScript-based frontend consumed data from multiple sources, correlated it in real-time, and presented it through an interface that balanced technical depth with accessibility. Whether a developer wanted to see high-level transaction flow or drill down into specific opcode execution, the tool provided the right level of detail at every step.

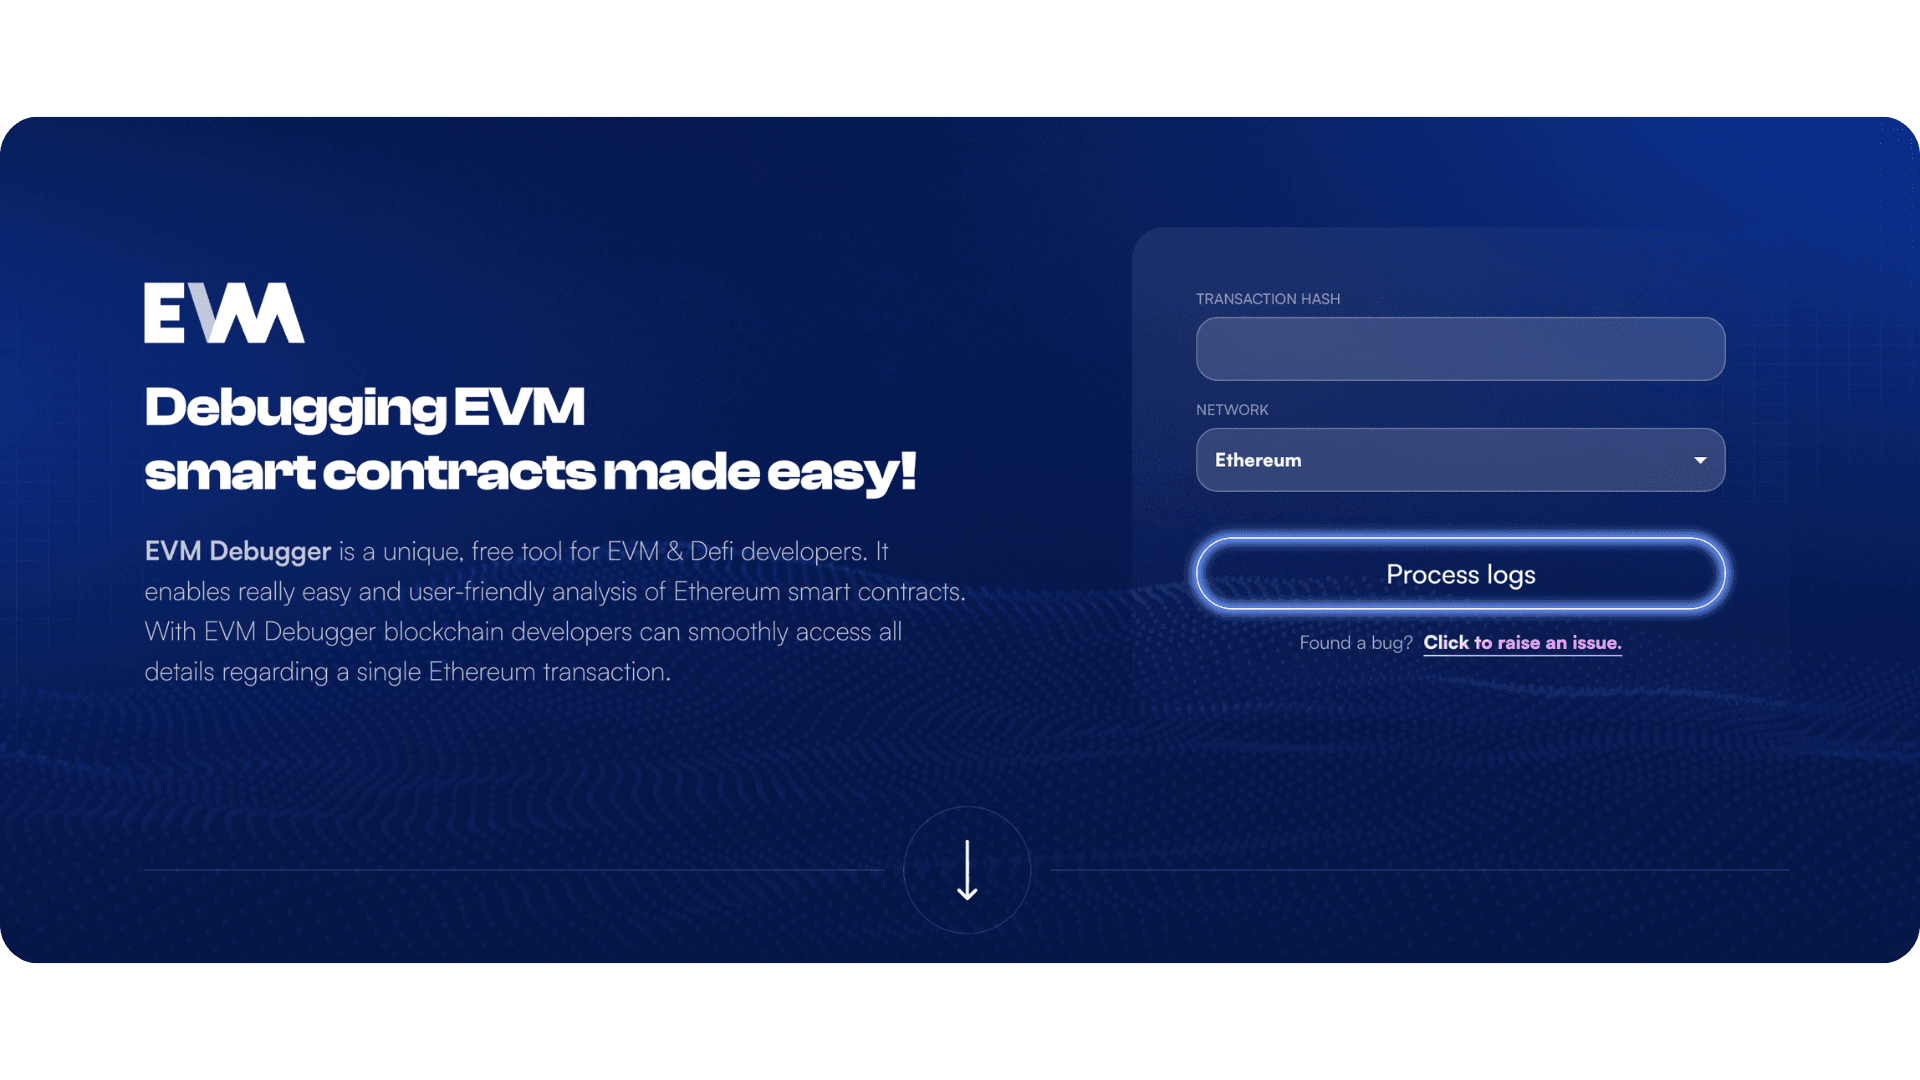
EVM Debugger successfully delivered an all-in-one platform that transformed how developers approach smart contract debugging. With a single transaction hash, developers could instantly access:
- Detailed state changes showing exactly how contract storage evolved throughout execution
- Event tracking that captured and displayed all emitted events in context
- Gas optimization insights through visual graphs that highlighted expensive operations
- Call hierarchy visualization revealing every nested call and its parameters
- Source code integration that linked bytecode execution back to readable Solidity code
- Storage analysis providing clarity on how data structures were modified
By consolidating fragmented information into one intuitive interface, the tool made smart contract development faster, safer, and more transparent. Developers could now troubleshoot failed transactions in minutes rather than hours, optimize gas usage with clear visibility into costs, and verify contract behavior before deployment with confidence.
The project demonstrated what's possible when developer experience becomes the primary focus. It proved that blockchain tooling doesn't have to be intimidating or fragmented - it can be accessible, comprehensive, and genuinely helpful.
As of October 31st, EVM Debugger is no longer available. What began as a passion project grew far beyond our initial expectations, attracting developers from around the world and processing countless transactions. However, as our team's focus shifted to other projects, we found ourselves unable to dedicate the resources necessary to maintain, develop, and optimize the tool to the standards it deserved.
If you're interested in keeping the EVM Debugger project alive or would like to discuss similar blockchain tooling initiatives, we'd love to hear from you at hello@rumblefish.dev. Thank you to every contributor to this amazing project, and goodbye to the EVM Debugger!

together!We will answer any questions you may have related to your startup journey!Do you prefer e-mail?
hello@rumblefish.pl